Total Ozone Over Pasadena
The total amount of ozone over Pasadena was 289 Dobson units on 27 Dec 2002.
This is 4 Dobson units less than normal for this date.
The Observations
Global maps of total ozone abundance are obtained by the NASA Total Ozone Mapping Spectrometer instrument, which flies on the Earth Probe satellite. We have used these space-borne observations to compile a time series of total ozone over Pasadena. The graph below shows measurements of total ozone for the year to date over Pasadena (red curve) compared to typical values of ozone for each day of year (black curves).
For the black curves in the above chart, the solid line shows the average value of total ozone for a 10 year period and dotted lines show the range of expected values (1 standard deviation variance about the mean).
This graph has many interesting aspects, which are discussed below.
Definition of Total Ozone
Total ozone is a measure of the number of ozone molecules between the ground and the top of the atmosphere. The concentration of ozone is typically expressed as the number of molecules per unit volume. For those with a mathematical background, total ozone is simply the integral of the ozone concentration with respect to height. Total ozone is recorded in "Dobson units", a unit of measure with special physical significance that honors a pioneering scientist (click here for more information on Dobson units).
The largest contribution to total ozone, typically 90% or more, is from ozone molecules that reside in Earth's stratosphere.
The Importance of Total Ozone
Scientists monitor total ozone because the amount of biologically active ultraviolet (UV) radiation reaching the surface varies inversely with total ozone. In other words, more UV radiation reaches the surface on days when total ozone is low. Excessive exposure to UV radiation over periods of time has been linked to increased rates of skin cancer (click here for more information on the links between ozone, UV radiation, and human health). All else being equal, days with low values of total ozone over Pasadena (e.g., 268 Dobson units of ozone on 21 February 2001) will have larger levels of UV radiation at the surface than days with higher values of total ozone (e.g., 397 Dobson units on 13 February 2001).
Day-to-Day Variations
The most striking aspect of the chart at the top of this page is the extraordinary day-to-day variation in total ozone over Pasadena. This variation is real: the TOMS measurement of total ozone is accurate to within a few percent. As we will illustrate below, these variations are due to the combination of Pasadena's location and stratospheric weather patterns.
In the northern hemisphere, total ozone tends to be largest at middle and high latitudes during late winter and early spring. The distribution of total ozone with respect to latitude and season has been known for quite some time. The following chart, reproduced from the pioneering work of Hans Dütsch, shows a map of total ozone (in Dobson units) versus latitude and time of year. This chart, produced from ground based and balloon-borne observations, was published in the Canadian Journal of Chemistry in 1974.
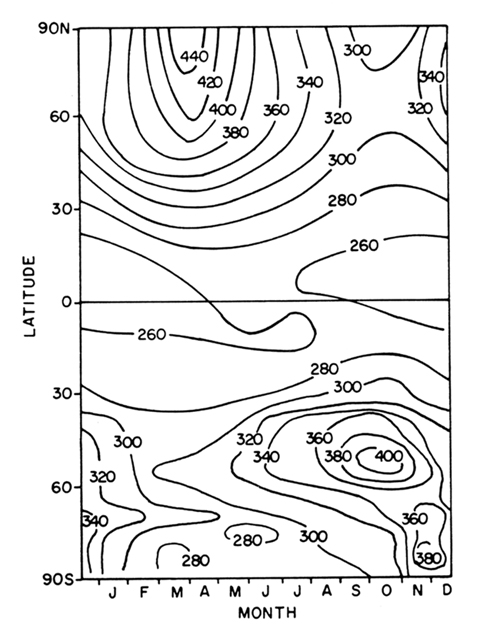
The chart shows that total ozone is more abundant at middle and high latitudes than at tropical latitudes. In general terms, this occurs because air first enters the stratosphere in the tropical regions and this newly minted stratospheric air tends to have small amounts of ozone. Ozone accumulates in stratospheric air parcels as they rise and spread to middle latitudes. These air parcels tend to sink at mid-latitudes due to the general circulation of the stratosphere. Ozone becomes more concentrated in these sinking air parcels because the air becomes compressed and also because chemical loss mechanisms for ozone tend to shut down as the air sinks, due to smaller amounts of ultraviolet radiation at lower altitudes.
Pasadena, at a latitude of 34.15°N, is located at the southern edge of the ozone rich region of the northern hemisphere.
The TOMS measurement of the global distribution of total ozone on 21 February 2001, shown below, illustrates the tendency for larger levels of ozone to accumulate at middle to high northerly latitudes.
21 February 2001
![]()
Note the large gradients of total ozone along the U.S. west coast on this day:
|
City |
Latitude |
Total Ozone on 21 Feb. |
| Pasadena, CA | 34.15°N | 268 Dobson units |
| San Francisco, CA | 37.76°N | 322 Dobson units |
| Seattle, WA | 47.45°N | 378 Dobson units |
As mentioned above, the day-to-day variation in total ozone over Pasadena is mainly due to its geographic location and stratospheric weather. We have seen that ozone rich air tends to accumulate at mid-latitudes during late winter and early spring. The position of this lobe of ozone rich air can be altered by stratospheric winds. On some days, this ozone rich air can be pulled as far south as Pasadena. The TOMS observations on 6 March 2001, shown below, provide a dramatic example of stratospheric winds pulling this ozone rich air over southern California (total ozone over Pasadena was 452 Dobson units on this day):
6 March 2001
![]()
A Movie
We have compiled a movie of TOMS images for a 60 day period in 2001 that illustrates how total ozone over Pasadena is affected by stratospheric winds. Click here for this movie, best viewed using a high speed internet connection. The chart shown at the bottom of the movie shows that total ozone over Pasadena can vary by more than 100 Dobson units over a several week period of time. The satellite images of total ozone at the top of the movie illustrate that stratospheric winds, by advecting either ozone rich air from higher latitudes or ozone poor air from lower latitudes to the southern Calif. area, are largely responsible for these short-term fluctuations.
A Dramatic Exception
There is a dramatic exception to the tendency for ozone rich air to accumulate at middle and high latitudes during winter. Air masses confined to southern polar regions experience rapid, nearly complete loss of ozone during late winter/early spring. This ozone loss occurs due to interactions between chlorine compounds, stratospheric clouds, and sunlight. The sequence of events that occur above Antarctica each spring leads to the so-called Antarctic ozone hole. Observations obtained by the JPL Microwave Limb Sounder (MLS) instrument, showing the association between air with high levels of chlorine monoxide (ClO) and low levels of ozone (O3):
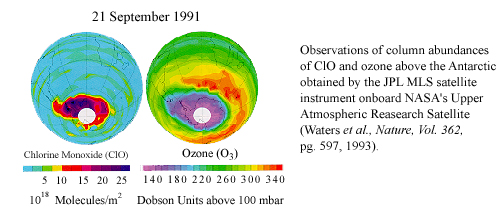
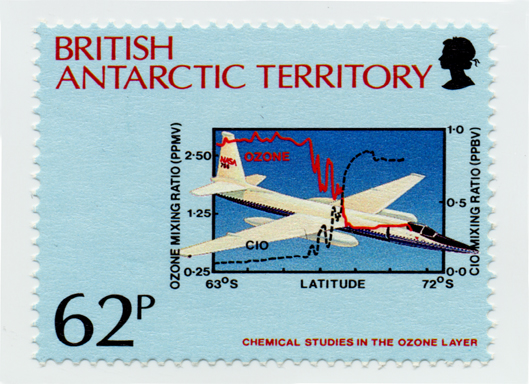
provide scientific evidence that chlorine dervied from industrial activities is the cause of the Antarctic ozone hole. A compelling observation obtained in the Antarctic stratosphere by instruments onboard the NASA ER-2 high altitude research aircraft, showing the association between pockets of air with high amounts of ClO and low levels of ozone on a variety of spatial scales, has been honored by depiction on a postage stamp.
Why is there an ozone hole over Antarctica, but not the Arctic? Stratospheric temperatures tend to be colder over Antarctica than the Arctic. Colder temperatures in the Antarctic stratosphere lead to more occurrences of clouds. Typically, clouds form in the lower atmosphere, or troposphere. However, if temperature becomes cold enough, these so-called polar stratospheric clouds can form, at an altitude of ~70,000 ft. These clouds are an essential ingredient of polar ozone loss because reactions that occur on the surface of these clouds convert chlorine from unreactive forms to highly reactive compounds (e.g., ClO) that cause rapid ozone depletion. The colder temperatures of the Antarctic stratosphere lead to more clouds, and hence greater levels of ozone depletion, than occurs in the Arctic stratosphere.
Recently, the Arctic stratosphere has become colder and as a consequence more clouds, and larger amounts of ozone depletion, have been recorded. Presently, a major focus of stratospheric research is directed towards understanding if this apparent trend towards colder conditions is linked to climate change.
Information regarding the development of the Antarctic ozone hole this year can be can be obtained from websites supported by the NASA Goddard Space Flight Center and another site sponsored by the NOAA Climate Monitoring and Diagnostics Laboratory.
Long-Term Trends
Data from the TOMS satellite provides an opportunity to examine trends in total ozone above Pasadena between the end of 1978 and the present time. The following chart shows the entire data record:
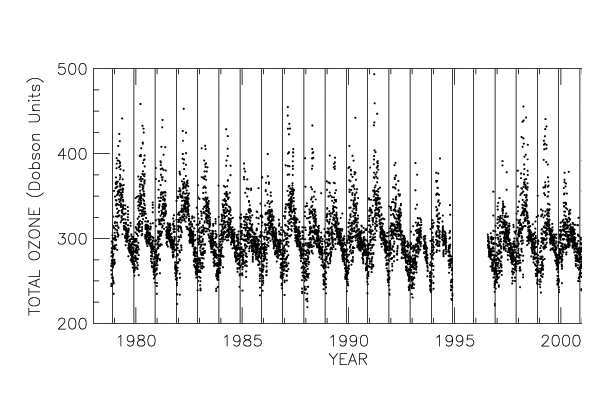
Lowest levels of total ozone over Pasadena occur every year during mid-November (the vertical lines on the chart are drawn at 15 November for each year). This seasonal low in ozone is related to more efficient chemical loss during summer as well as less isolation of air at middle to high latitudes during late fall compared to early spring. Even though total ozone reaches a minimum during November, the amount of ultraviolet radiation reaching the surface is larger during summer because, at this time, the sun is higher in the sky (attentuation of ultraviolet radiation depends on the total ozone and sun angle, or the position of the sun in the sky. On any given day, peak ultraviolet exposure occurs near noon, the time at which the sun is highest in the sky).
This 23 year data record data record can be examined to address whether ozone levels over Pasadena have declined during the past decade. The chart below compares the seasonal variation of ozone over Pasadena for two time periods. The black curves show data collected from 1978 to 1989. The red curves show observations from from 1990 to 2000. The solid curves show the average amount of total ozone over Pasadena for each time periods. The dotted curves show the variance of ozone, defined as one standard deviation of the mean. All curves shown below have been smoothed with a 20 day running average so that long term changes are more apparent.

This chart reveals that ozone over Pasadena was lower during the 1990s than during the 1980s. Lower amounts of ozone are apparent throughout most of the year. The difference reaches a maximum of about 10 Dobson units during spring (days 90 to 150). This difference would, all else being equal, result in 4 to 6% more ultraviolet radiation reaching the surface during the 1990s than for the 1980s. Measurements collected at other sights have shown a clear association between decreases in stratospheric ozone and increases in ultraviolet radiation.
Averaged over the course of the year, the data record shows total ozone over Pasadena was 2% lower during the 1990s compared to the 1980s. This amount of ozone depletion is in good agreement with a more sophisticated analysis of trends in global ozone, as reported in the 1998 WMO Scientific Assessment of Ozone Depletion report. Scientific studies using computer models that simulate stratospheric chemistry and meteorology, summarized in the same report, conclude that this amount of ozone depletion is consistent with the expected change due to the build-up of stratospheric chlorine that has resulted from the release of CFCs and other halocarbons during the past several decades.
The above chart also shows that the difference in ozone between the 1990s and 1980s is small compared to the observed variance for either decade. The fact that stratospheric winds can induce large day-to day variations in total ozone over places such as Pasadena has been emphasized throughout this page. Thus, for an individual concerned with exposure to ultraviolet radiation, it is important to have information about local conditions on a particular day. Such information is often given as the UV exposure index in the weather section of newspapers. Click here to find the UV exposure index at your location, a service provided by the Environmental Protection Agency (EPA).
Finally, it must be stressed that any serious attempt to define ozone depletion would not consider data at a single sight. A shift in stratospheric winds, due either to the vagaries of weather or perhaps a persistent change in climate, could potentially lead to trends in total ozone over Pasadena due to slight changes in the frequency of appearance overhead of high latitude (ozone rich) or tropical (ozone poor) air stratospheric air masses. Similarly, a scientist studying climate change would be remiss to only examine a temperature record from a single sight. Nonetheless, exposure of Pasadena residents to ultraviolet radiation is governed by the abundance of total ozone at this single sight! It is interesting, but perhaps coincidental, that trends in total ozone over Pasadena found by this simple analysis, about 2% depletion per decade, agree so well with trends in total ozone found by more sophisticated analyses that examine global data.
[Back to Top]
[Back to the
Atmospheric Chemistry Homepage]
Author: Ross J. Salawitch
Page Design: Aaron B. Milam
Revised: 28 December 2002